The “Real Return” Reality Check: FDs in the 30% Tax Bracket
Fixed deposits (FDs) remain the default anchor for Indian portfolios, especially when you need a familiar place to park surplus cash. They offer clarity, predictability, and relief from market swings. For high-income earners, that dependability feels like steady progress without active effort.
But in the 30% tax bracket, this comfort is a mathematical illusion. Once you adjust the headline rate for taxes and long-term inflation, the outcome changes materially. The balance keeps rising, but your purchasing power quietly shrinks.
Read on to explore how that erosion happens and how disciplined investors think about it differently.
The 10-Year Real Return Analysis: What Your FD Actually Delivers
The best way to evaluate an FD is to track its performance over time, not just its maturity value. Let’s understand this with a 10-year illustration based on realistic assumptions for a high-income investor:
- Tax slab: 30% (annual income >₹24L as per Budget 2025-26)
- FD rate: 7% fixed annually
- Inflation: 6% average
- Tax timing: Interest taxed every year
- Reinvestment: Only post-tax interest reinvested
- Other conditions: No premature withdrawals, bonus rates, or special FD variants
With these inputs, you can trace how the FD compounds and where return erosion begins.
1. Nominal FD Rates vs. What Reaches Your Bank
When a bank advertises a 7% fixed deposit, it is quoting a nominal interest rate. This is the gross rate before accounting for taxes or inflation. Yet this is the number most investors anchor their expectations to.
Suppose you invest ₹10 lakh in a cumulative FD at 7% for 10 years.
- Principal: ₹10,00,000
- Interest rate: 7% (Compounded Annually)
- Final maturity value: ~₹19.67 lakh
At first glance, it looks like a solid outcome. The capital nearly doubles, with a gain of almost ₹9.7 lakh. For many investors, the analysis stops here, and they treat maturity value as proof of successful long-term wealth creation.
But nominal returns are theoretical. What matters is how much of that return actually survives tax.
2. How Taxation Shrinks Your FD’s Growth Curve
Interest earned on fixed deposits is fully taxable in India. Unlike instruments where tax is deferred until exit, FD interest is taxed every year as it accrues. In effect, your returns are treated the same way as a regular salary or business income.
For high-income earners in the 30% slab, this creates a “compounding drag”.
Here’s the simple math:
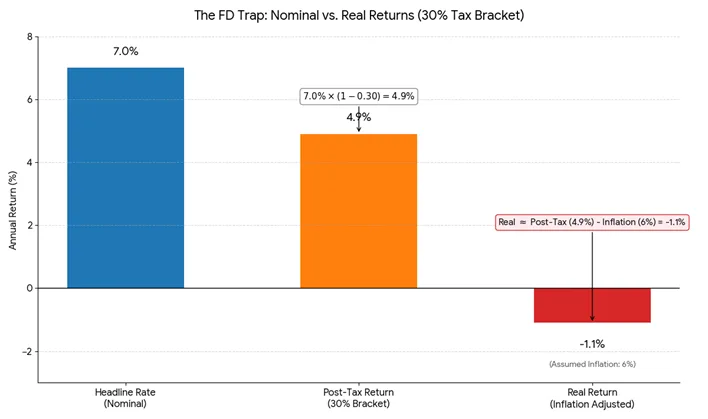
Post-tax FD return = Nominal rate × (1 − tax rate)
7% × (1 − 30%) = ~4.9%
A 7% FD does not compound at 7% for you. It compounds at roughly 4.9% after tax. Now apply this to the same ₹10 lakh investment over 10 years:
- At 7% nominal, ₹10 lakh grows to ~₹19.67 lakh
- At ~4.9% post-tax, it grows to only ~₹16.1 lakh
The ₹3.5 lakh difference is not market risk. It is the silent cost of annual taxation, reducing the compounding engine long before inflation is applied.
3. Inflation: The Silent Erosion of Wealth
Tax weakens how fast your FD grows. Inflation determines whether it preserves value at all.
Historically, India’s CPI inflation has averaged 4-7%. For high-income individuals, actual lifestyle inflation is often higher due to rising costs of healthcare, education, travel, and services.
To understand what your money is really worth, you must adjust the post-tax amount for inflation.
Real value = Post-tax FD value ÷ Inflation factor
At 6% inflation, prices compound by a factor of (1.06)^10 ≈ 1.79 over 10 years. It means something that costs ₹10 lakh today will cost about ₹17.9 lakh after 10 years.
Now apply this to your FD:
- Account balance after 10 years: ~₹16.1 lakh
- Real purchasing power: ~₹8.9 lakh
The result is a negative real return of roughly −1.1% per year. The FD grows on paper, but ten years later, it is worth less than the ₹10 lakh you invested.
What Smart Investors Do Instead: Compare Risk-Adjusted Alternatives
If FDs lose value in real terms, what should a disciplined investor consider instead?
The answer is not to chase the highest number or jump into unfamiliar products. It is to move away from product-led decisions and start building a risk-adjusted portfolio.
Here is a simple four-step framework you can use:
Step 1: Shift From “Highest Return” to “Risk-Adjusted Return”
Smart investors do not ask, “Which option pays the most?” They ask, “What survives after tax, inflation, and liquidity constraints?”
A 7% FD feels low-risk, yet it yields a negative real return for a 30% taxpayer. To do better, you must evaluate three factors together:
- Net Yield: What actually hits your bank account after tax and costs?
- Volatility: How much uncertainty are you willing to accept for a higher return?
- Liquidity: Can you access your money instantly without penalties or forced losses?
Pro Tip: The goal is not maximum yield. It is to achieve predictable, repeatable outcomes aligned with risk tolerance and time horizon.
Step 2: Compare Instruments by How They Generate Returns
Different fixed-income options generate returns through distinct mechanisms. Each behaves differently under tax, inflation, and market stress. So instead of chasing brochure rates, compare instruments by their return engine:
- Fixed Deposits: Returns come from a bank’s lending spread. As a depositor, you occupy the lowest-risk and lowest-yield position in the system.
- Debt Mutual Funds: Returns come from bonds, not guarantees. Performance depends on interest-rate movements and credit quality. You earn when bond prices move in your favour, but outcomes can vary across market cycles.
- RBI-Regulated Peer-to-Peer Lending: Returns come from interest repayments by a diversified pool of credit-assessed borrowers. When credit discipline is applied, this structure can outsmart inflation and provide a risk-adjusted alternative to fully taxed FDs.
Step 3: Assess Liquidity and Cash-Flow Design
Returns only matter if you can access the money when you need it. That’s why liquidity and cash-flow design deserve as much attention as yield.
- Fixed deposits: Capital is locked until maturity. Early withdrawal is possible, but penalties and lower reset rates quietly eat into returns.
- Debt Mutual Funds: Liquid, but market-dependent. You can exit anytime, but the value depends on the NAV that day. You control when you sell, not the price you get.
- P2P Lending: Cash flows usually come in through monthly borrower repayments. This approach generates regular passive income you can spend or reinvest.
Remember: Liquidity planning is not an afterthought. Matching cash-flow timing to your goals is a core part of risk-adjusted investing.
Step 4: Use Diversification to Balance Stability, Liquidity, and Yield
There is no one perfect fixed-income product. Stability, liquidity, and real returns rarely come in the same package, which is why disciplined investors diversify across:
- Stability anchors: FDs and government securities to protect capital and manage short-term certainty
- Market-responsive assets: High-quality debt funds to benefit from interest-rate cycles.
- Yield-enhancing components: Regulated alternatives such as P2P lending to provide the “margin” needed to beat inflation.
Pro Tip: Diversification reduces concentration risk and boosts the likelihood of achieving positive long-term returns.
A Real-Return Checklist Before You Choose an FD
Before you lock money into an FD, run it through this reality check:
- Calculate what you earn after tax based on your actual slab, not the advertised rate
- Stack that post-tax return against expected inflation, not today’s comfort level
- Check the time frame. FDs work for short parking, not long holding periods
- Use FDs for capital stability and near-term needs, not wealth building
- Treat FDs as one layer in your fixed-income mix, never the foundation
Stop Parking Your Money. Start Growing It.
Fixed deposits are not broken. But high-income earners are often misunderstood. A 7% FD can look stable and reassuring, yet once tax and inflation are applied, the outcome may quietly work against you.
The solution is not to abandon FDs. It is to use them intentionally. Keep FDs for short-term stability while complementing them with other regulated fixed-income avenues that generate returns in different ways.
The objective is not higher risk. It is a smarter construction that helps your money preserve and grow purchasing power over time.
At LenDenClub, we help investors complement traditional FDs with RBI-regulated P2P lending — so their idle money works harder through diversified, data-driven fixed-income opportunities, without losing sight of risk or discipline.
In case you want to learn more about how P2P lending fits into a balanced fixed-income strategy, explore our resources and see how RBI-regulated investing can help your money work smarter!
FAQs
Not bad, but often inefficient. After tax and inflation, FDs can reduce purchasing power for investors in the 30% tax bracket.
Occasionally, in lower tax slabs or during short inflation dips. Over long periods, post-tax FD returns usually lag inflation.
FD interest is taxed every year as regular income. This reduces a 7% FD to roughly a 4.9% post-tax return.
Instead of relying only on FDs, many investors spread money across debt funds, government securities, and regulated P2P lending.

Team LenDenClub
LenDenClub is India’s largest peer to peer lending platform which started operations in India in 2015. We have been helping lenders diversify their portfolio beyond traditional investment instruments ever since.